Did You Know ?
1. The
average temperature of the lower two miles of the air above the Earth’s
surface has grown much warmer in the last 100 years, and especially in the
last few years.
2. Wind patterns are changing on the Earth’s surface as some areas
are getting much warmer and others much cooler.
3. Changes to Earth’s climate are changing the amount of sea ice in
the Antarctic, which is causing Adélie Penguin populations to change.
How We Know About Climate Change
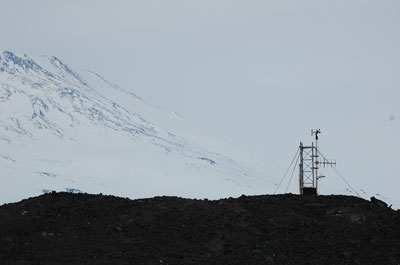
Less than 200 years ago (1724), thermometers were invented and ever since then people have been keeping records about how warm or cold it is. About that time people began keeping records about how windy it was, too, but first they did this by a descriptive scale. For example, they would write that smoke from chimneys is going straight up; or it’s windy enough that the leaves of trees are rustling. It wasn’t until about 1850 that an instrument was invented to measure the actual speed of the wind. The instrument was called an anemometer. The wind causes a propeller to turn, which causes electricity to be generated (just like in a wind farm generator today, but at a much smaller scale); the amount of electricity produced increases with wind speed and this is measured on a dial. With this new tool, people began to keep numerical records of wind speed to go along with the temperature records. These are called weather records. Weather stations began to appear all around the globe for comparison of one place to another.
When Ernest Shackleton wanted to go to the South Pole in 1909, he organized an expedition from England to the Antarctic and his men brought a weather station. This station consisted of a wooden box, with slats on the side, so that air would circulate through it, but the sun light would not fall directly on the thermometers inside. If that happened the thermometer would rise higher than the actual air temperature. This is called a ‘Steven’s box’ after the weather man who invented it. On top of the Steven’s box was an anemometer.
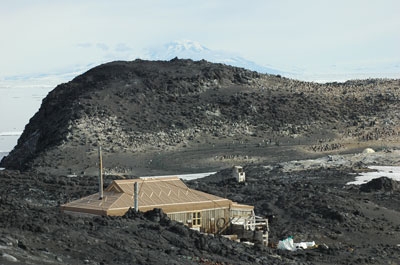
The hut that Shackleton’s men built at Cape Royds in 1909. The Steven’s box is on the little hill just above the hut to the right, and below the penguins in the background.
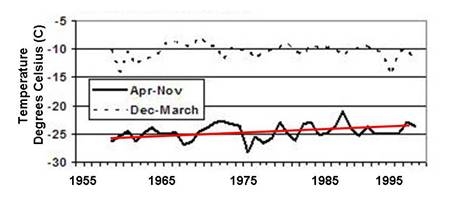
Here’s the record of temperature from Scott Base on Ross Island (near Cape Royds) for the last 50 years. In those 50 years, the average temperature in winter (April to November) has increased about 2 degrees (red line). Since Shackleton’s day it has increased about 3 degrees.
We
know the periods with greater wind because there is more sea salt or dust
in the ice layers. The wind picks up salt from the ocean surface and dust
from the land and takes it high into the atmosphere. The higher the wind
speeds, the more of this stuff is found in the atmosphere. This material
combines with snow flakes. The snow falls and eventually turns to ice
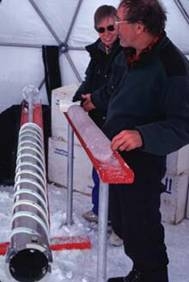
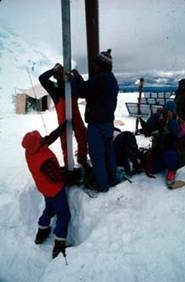
which form glaciers. Scientists then drill into the glaciers to extract
long cores of ice. Holding the ice cores up to a bright light (inside
a refrigerated room) they can see the layers. When they find a layer full
of dust from a volcano, they know how old that layer is based on when
that volcano erupted. They then count the layers away from that one to
determine when each of the others was formed (remember, like tree rings,
one layer every year).
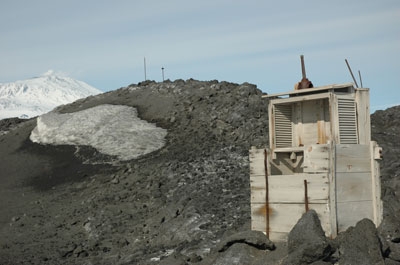
The 100-year-old Steven’s box at Cape Royds with Mt Erebus in the background. Thermometers were inside and an anemometer spun on the metal spoke sticking upwards from the top. The door blew away long ago, but had slats as well. A person had to open the door, read the dials and then record the data.
Also trapped in the layers are traces of atmospheric gases. Snow flakes are made of frozen water, which contain hydrogen and oxygen. The oxygen atoms come in several forms depending on the size of their nucleus. One kind is called oxygen-eighteen (O18) and another is called oxygen-sixteen (O16). O18 is heavier than 016, so when the water crystallizes to form a snow flake O18 comes out of the atmosphere sooner than O16 depending on the temperature at the time. Scientists can then relate the amount of O18 in the ice to what the temperature was when the water evaporated from the Earth’s surface and when it formed snow flakes in the atmosphere. Pretty cool, huh?
These
ice cores, along with the sediment cores described in “Ageing
colonies”, can be used to reconstruct changes in Earth’s
climate as well as the effects of those changes on the ocean and sea ice.
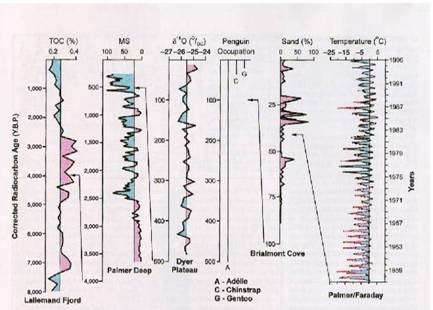
Here are 5 climate and/or sea-ice proxies, along with direct measurements
of temperature, with the time scale reading up-down. In the rightmost portion
is the temperature record, with the time span being just 50 years. As you
read each record from temperature to the left, the time scale gets longer
and longer from the present: 2) sand in sediment core goes back 100 years;
3) penguin occupation back 500 years; 4) O18-O16 ratio back 500 years also
from a glacier core; 5) magnetic susceptibility in a sediment core (something
we’ll not go into) goes back 4000 years; and 6) amount of carbon from
diatoms (TOC) in a sediment core, going back 8000 years. Look at the sand
record and the temperature record. As temperature has been rising so has
the amount of sand deposited in coastal bays. The warmer temperature creates
more runoff from glacier melt. Similarly, you can see the warming temperature
record during the last 50 years as pink on scale #3. The fact that it’s
warmer, means that the sea ice has been melting sooner in this area (see
“Ageing colonies” section),
and that’s why there is more organic carbon (TOC) now in the sediment
--- less sea ice has pulled the ‘shade’ of sea ice back from
the sea surface allowing more sunlight and therefore more microscopic plant
growth in the water. In any case, these are all climate proxies. The appearance
of G (Gentoo) and Chinstrap (C) penguins during the last 30 years in the
penguin record (based on bones found in deposits) confirms that sea ice
is disappearing (G and C are open-water species: see section on “Climate
& Penguins”).
Finally,
we now have direct measurements of sea ice as well as the amount of phytoplankton
(small ocean plants) as a result of satellites that can take direct visual
images of Earth’s surface. The sea ice and ocean phytoplankton records
from satellites during the past 30 years (there were no Earth sensing satellites
until 1973) help to confirm the climate proxies from glacier and sediment
cores.